Europe has spent much of 2026 talking about technological sovereignty. On 14 September, Christine Lagarde, President of the European Central Bank, put the problem unusually plainly in a speech on growth, sovereignty and artificial intelligence:
“Adopting, for Europe, means importing.”
Her argument was not that importing technology is inherently bad. Europe has benefited enormously from technologies developed elsewhere. Her concern was dependency: AI is moving into banking, healthcare, transport, public administration and the systems businesses increasingly rely on to operate. The more important the technology becomes, the more consequential dependence on external suppliers can become.
At almost exactly the same moment, yellow3's Model Adoption instrument was producing another way of looking at that dependency.
Not through funding rounds, benchmark announcements or company valuations, but through routed usage.
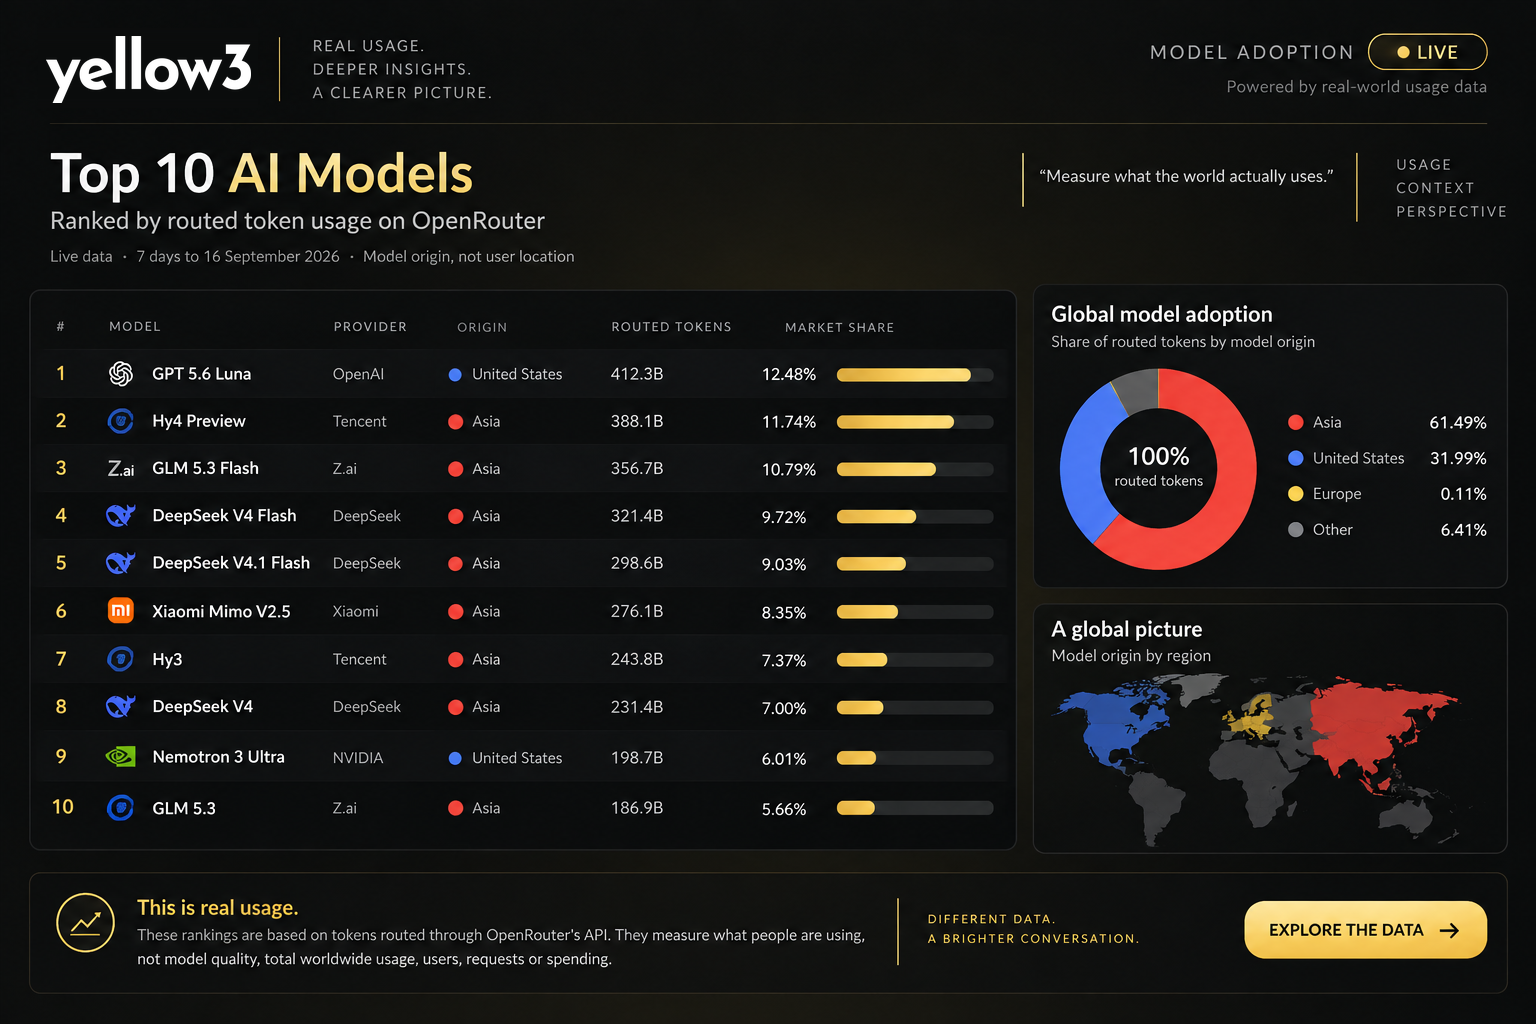
For the seven days ending 16 September 2026, models built in Asia accounted for 61.49% of routed tokens measured by yellow3. US-built models accounted for 31.99%. Another 6.41% came from models classified as Other, including developers that cannot be cleanly assigned to Asia, Europe or the United States.
European-built models accounted for:
0.11%.
The regional percentages total 100%. The weekly changes do too, subject to rounding: Asia fell 1.40 percentage points, the US gained 0.93, Europe gained 0.05 and Other gained 0.41.
That number deserves attention. It also deserves context.
This is not global AI market share
yellow3 Model Adoption measures combined prompt and completion tokens routed through OpenRouter over a trailing seven-day period. OpenRouter's rankings measure usage through its API, not usage on model providers' own platforms and not the whole AI market. They also do not measure model quality, users, requests or spending.
That distinction is fundamental.
A company using OpenAI directly does not appear here. Neither does a company consuming Mistral entirely through Mistral's own infrastructure, nor enterprise traffic going through other cloud relationships. This is a view of one large multi-model routing environment.
But that does not make the signal uninteresting. It makes the question more precise:
When developers and applications operate in an environment where many models can compete for routed usage, where does that usage flow?
Right now, overwhelmingly, it flows to models built outside Europe.
Why is Europe at 0.11%?
There is an obvious challenge to the number, and it needs to be taken seriously.
European model usage may be structurally underrepresented on OpenRouter.
Mistral, Europe's most visible foundation-model company, operates its own developer API and platform. Its models are also available through Microsoft's cloud ecosystem, including Azure AI Foundry. A European company using Mistral through either of those routes would not necessarily generate a single token in the OpenRouter dataset.
Channel mix therefore matters. It is entirely possible that European models perform better outside OpenRouter than they do inside it.
There is also a catalogue effect. In the 16 September yellow3 snapshot, 24 published models were attributed to Asia, 27 to the United States and only one to Europe. More models create more opportunities to accumulate routed usage. That imbalance is partly a measurement issue, but it is also a market fact worth examining. Europe currently has far fewer models competing at meaningful scale in this particular channel.
Price may matter too. yellow3 explicitly treats OpenRouter traffic as developer-skewed and cost-sensitive, and OpenRouter actively promotes free inference as part of its platform. That environment can benefit models competing aggressively on price.
But the Asian lead cannot simply be dismissed as free models winning. OpenRouter ranks free variants separately, and in the top ten published by yellow3 on 16 September, the only model explicitly identified as a free variant was NVIDIA Nemotron 3 Ultra, an American model at number nine.
We cannot establish from the public aggregate data how much discounted pricing contributes to Asia's 61.49%, so we should not pretend we can.
The honest conclusion is narrower.
Some of Europe's weakness may be channel mix. Some may reflect catalogue depth. Economics almost certainly affects developer behaviour. What the data cannot tell us yet is how much each factor contributes.
What it can tell us is that European-built models currently have almost no presence in this particular competitive routing market.
That is still significant.
The top ten looks very different from the AI conversation
The regional totals only tell part of the story.
OpenAI's GPT 5.6 Luna occupied the number-one position in the 16 September snapshot. The other US-built model in the top ten was NVIDIA's Nemotron 3 Ultra at number nine.
The remaining eight positions were occupied by Asian-built models from Tencent, Z.ai, DeepSeek and Xiaomi. Tencent held two positions, DeepSeek three, Z.ai two and Xiaomi one. Europe's highest-ranked model, Mistral Nemo, sat at number 52.
That picture differs sharply from much of the public AI conversation, which still tends to revolve around a familiar group of American companies.
The routed data shows that another market has been developing underneath that conversation.
Asian-built models are not merely appearing on benchmarks or being discussed as future challengers. In this dataset, they are already carrying the majority of measured token traffic.
Dependence can simply move
Europe's AI dependency is often framed principally as dependence on American technology.
The adoption data suggests a more complicated possibility.
Dependence can simply move.
From one supplier to another.
From one region to another.
From proprietary American models to lower-cost or open-weight Asian alternatives.
Lagarde made a related observation on 14 September when she contrasted Europe's model output with that of the US and China and discussed the strategic implications of relying on technologies produced elsewhere.
Greater model choice is good for buyers. Competition can lower costs, improve capability and reduce dependence on any single company.
But supplier diversity and technological sovereignty are not the same thing.
A European company capable of switching instantly between five non-European models may have less vendor concentration while remaining almost completely dependent on technology developed outside Europe.
That distinction matters.
Europe is investing. Adoption is the harder test.
The European policy response is already substantial.
On 3 June 2026, the European Commission presented its European Technological Sovereignty Package, covering semiconductors, cloud, artificial intelligence and open source. The Commission explicitly linked the measures to reducing dependence on non-EU providers and increasing European technological autonomy.
On 16 September 2026, 19 EU Member States moved forward with the first proposed Important Project of Common European Interest dedicated to AI. The initiative covers the AI stack from compute management and technology through industrial products and services, with the Commission explicitly connecting it to European digital sovereignty and adoption.
Europe therefore does not have an awareness problem. Policymakers understand the strategic issue, infrastructure is being funded, open-source alternatives are part of the policy agenda and the EU is trying to increase European capability across the technology stack.
The more difficult question is whether those efforts translate into technologies people actually choose to use.
That is where adoption data becomes interesting.
The gap is larger than one bad week
A single seven-day period should never carry an argument by itself.
yellow3 therefore keeps the history.
Europe's highest share recorded by the instrument was 0.75%, reached on 22 May 2026. By 16 September it stood at 0.11%. Europe actually gained 0.05 percentage points in that latest week, so the argument is not that its share moves relentlessly downward.
Models launch. Free tiers appear. Prices change. Developers experiment. Applications move workloads. Weekly rankings can change quickly.
The more durable observation is scale.
Even at its recorded high-water mark, Europe remained below 1% of routed token usage in this dataset.
That does not prove Europe has 1% of AI.
It does show that European-built models have so far struggled to capture meaningful adoption in this particular market.
Dependency is becoming a product decision
The implications are not limited to governments.
Any company building AI into a product or an internal operation is making infrastructure choices, whether it describes them that way or not. A model decision creates technical, commercial and sometimes geographic dependencies.
A sensible procurement question is therefore no longer simply, “Which model performs best?”
Teams increasingly need to understand capability, economics, availability, substitutability and origin together. Can the workload move to another provider? Can it move to another region? Is an open-weight version available? What breaks if pricing changes or an endpoint disappears? How expensive would migration be?
That turns model dependency into a design variable.
And once companies begin treating it that way, regional adoption becomes more than an interesting leaderboard statistic.
It becomes intelligence about the infrastructure market underneath AI.
Why yellow3 measures adoption
Most AI rankings attempt to answer some version of:
Which model is best?
We are interested in another question:
What is actually being used?
Those questions are not substitutes for one another.
A model can perform brilliantly in an evaluation and see little adoption. Another can be slightly weaker on a benchmark but become widely used because it is cheaper, easier to integrate, open-weight, faster or simply good enough.
That is why the yellow3 instrument keeps both the current ranking and the history behind it. Each model has its own record, and changes in position, adoption and evidence remain inspectable rather than disappearing with the next daily refresh.
A benchmark is a test.
An announcement is an intention.
A launch is an event.
Adoption is behaviour.
And behaviour can reveal a market that the headlines have not caught up with yet.
The number to watch is not necessarily 0.11%
Europe's 0.11% share makes a powerful headline because it exposes the scale of the gap.
But the more important question is what happens next.
If European policy, investment and model development begin working, eventually that should become visible not only in the number of models Europe produces, but in whether developers and businesses choose them.
If European models become more competitive on capability, economics or deployment flexibility, their routed share should begin to move.
If it does not, that tells us something too.
The value of the instrument is therefore not that it produces one dramatic number. It is that the same measurement can be repeated.
Today the snapshot reads:
Asia 61.49%.
United States 31.99%.
Europe 0.11%.
Other 6.41%.
The figures do not settle the debate over European AI sovereignty.
They give us something with which to measure it.
The AI market looks different when you stop measuring what the industry says and start measuring what gets used.
About the data
yellow3 AI Model Adoption measures combined prompt and completion tokens routed through OpenRouter over a trailing seven-day period. Region refers to where the model developer is headquartered, not the geographic location of the user or the server. The data is developer-skewed and cost-sensitive and excludes substantial direct-provider and enterprise usage. It should therefore be read as an indicator of routed model adoption, not worldwide AI market share.
This article uses the yellow3 snapshot for the seven days ending 16 September 2026.